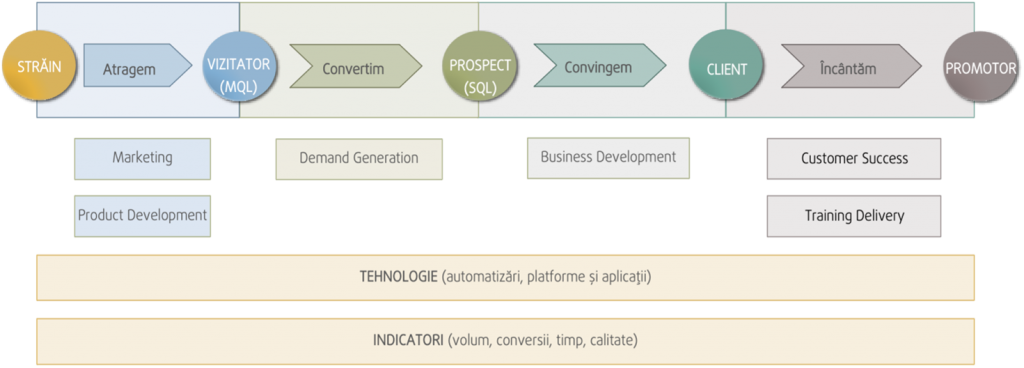
2021 was a typical year for the Education Division, in the sense that we returned to the classic model in the training industry in which the first term represents 40% of the sales figures, while the second term 60%, as we were used to before the pandemic. Below you can find the main activities of each team, as they are involved in “Buyer Journey”, our new business model that we initiated two years ago, we have rigorously implemented throughout 2021 and which is starting to have good results. For example, we have 50% more customers in 2021 than in 2020, who will keep buying over the coming years.
| 31.Dec.21 | 31.Dec.20 | ||
| Revenues | 14,156,623 | 12,794,103 | 10.6% |
| Cost of sales | 6,965,069 | 5,024,193 | 38.6% |
| Cost for selling goods /materials | 208,128 | 878,855 | -76.3% |
| Hours/worker | 6,756,941 | 4,145,337 | 63.0% |
| Gross margin | 7,191,554 | 7,769,911 | -7.4% |
| Other revenues | 929,797 | 303,544 | 206.3% |
| Sales /distribution expenses | 3,920,895 | 2,305,830 | 70.0% |
| Staff expenditure | 2,850,062 | 1,732,169 | 64.5% |
| Advertisement | 1,070,833 | 573,661 | 86.7% |
| Administrative expenses | 4,988,980 | 2,704,719 | 84.5% |
| Staff expenditure | 1,642,226 | 1,239,552 | 32.5% |
| Amortization | 1,296,599 | 557,590 | 132.5% |
| Other third party services | 1,208,688 | 406,643 | 197.2% |
| Other expenditures | 360,858 | 235,170 | 53.4% |
| EBIT | (788,525) | 3,062,905 | -125.7% |

