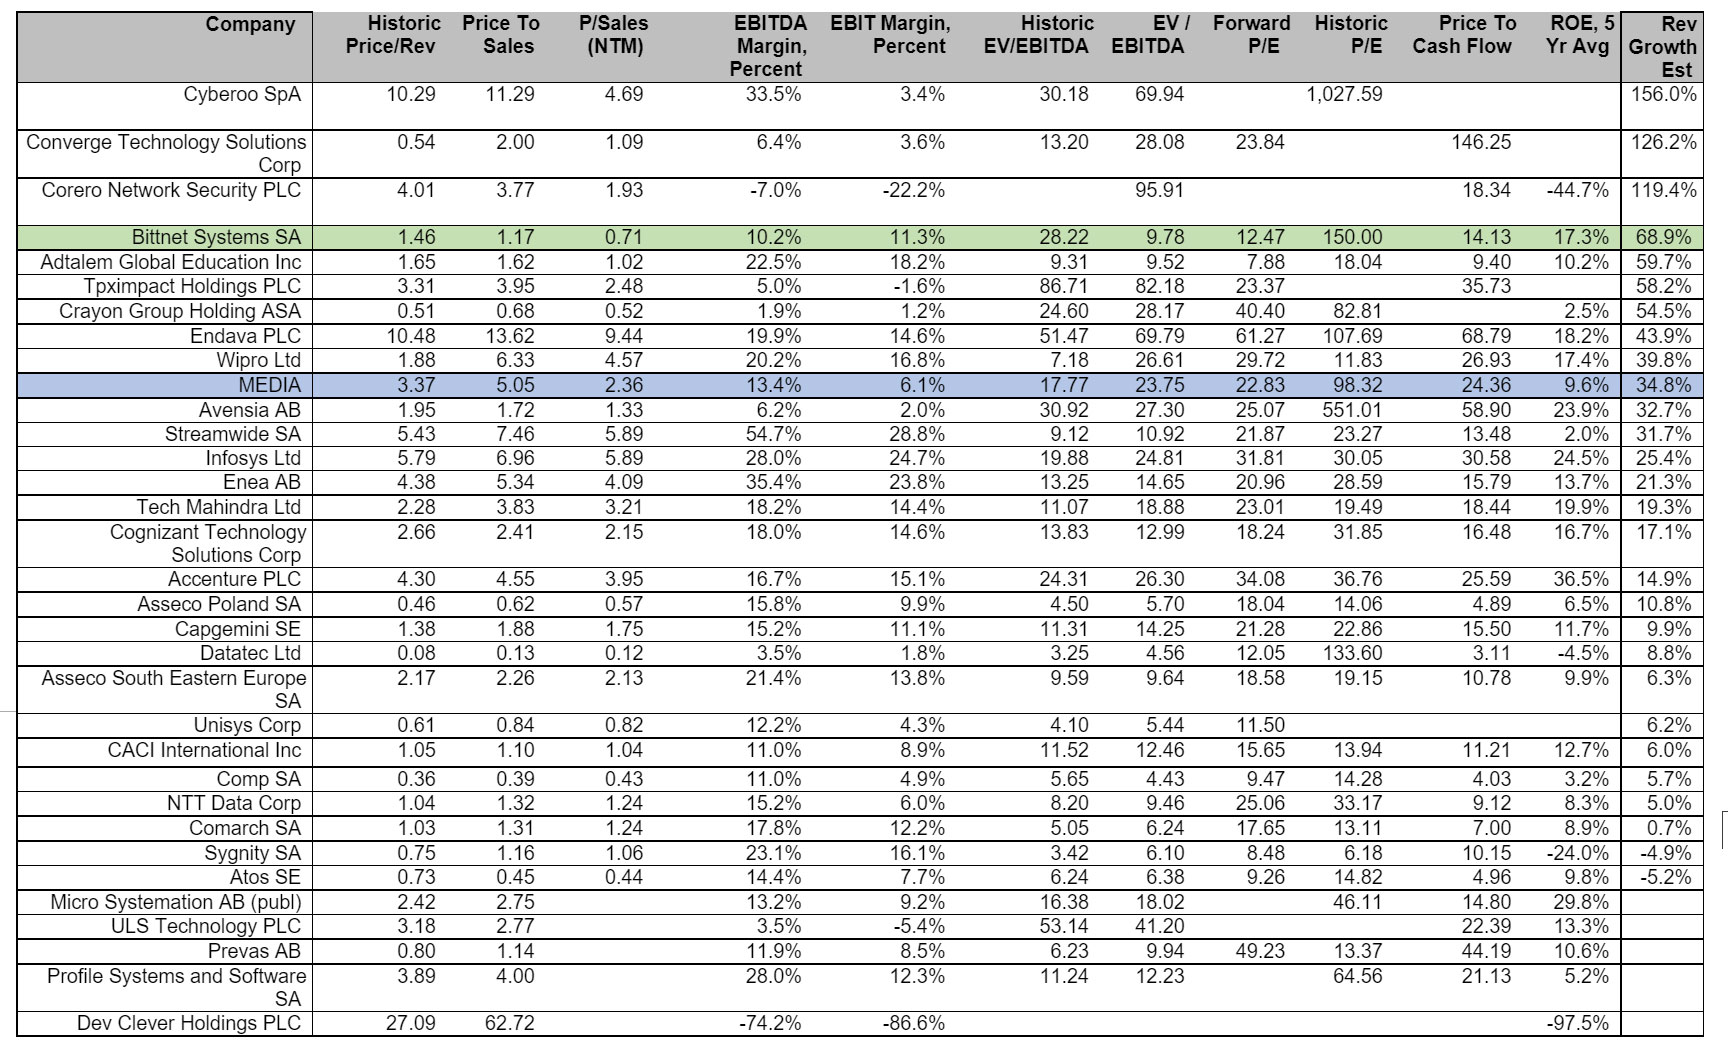
We mentioned in the chapter “Stock Exchange Evolution” that the current multiples of BNET record values significantly below the average of similar companies listed on international markets, given that the return on capital brought by shareholders is significantly higher in the case of BNET, the situation being similar in case of revenue increase (size of business). We further reproduce the table based on which we documented the respective statement. The data are extracted from the Eikon Reuters system on October 13, 2021.
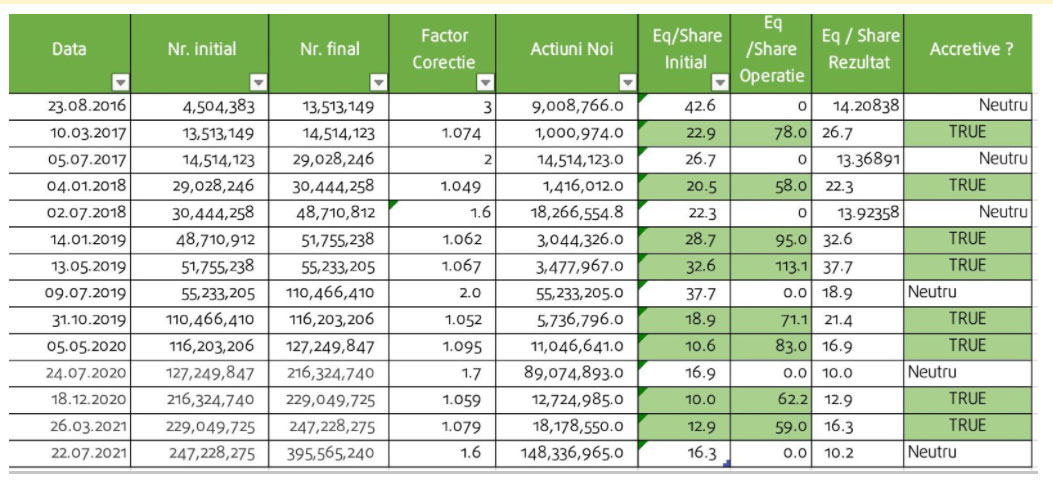
The return on capital invested by shareholders was calculated according to the IRR formula, and is reproduced below, along with the mathematical demonstration of the statement “all capital increases made by the Company (including those for SOP or acquisition of companies with free shares) have brought value to shareholders who did not participate – an average return over 20% for shareholders who did NOT participate:
| 15/04/2015 | Equity April 15, 2015 |
-864,743 |
| 05/12/2017 | Capital Increase December 5, 2017 |
-807,127 |
| 14/12/2018 | Capital Increase December 14, 2018 |
-2,892,205 |
| 10/04/2020 | Capital Increase April 10, 2020 |
-9,168,712 |
| 02/03/2021 | Capital Increase March 02, 2021 |
-10,725,345 |
| 30/09/2021 | Equity on September 30, 2021 |
49,071,003 |
| Of which, amounts attracted |
-23,593,389 |
|
| IRR |
43,7% |
Nothing in this chapter is an investment recommendation. Investing in stocks involves risks. Please read carefully the Universal Registration Document and the chapter „Risk Factors” also provided in this Report before you decide to invest in our shares.